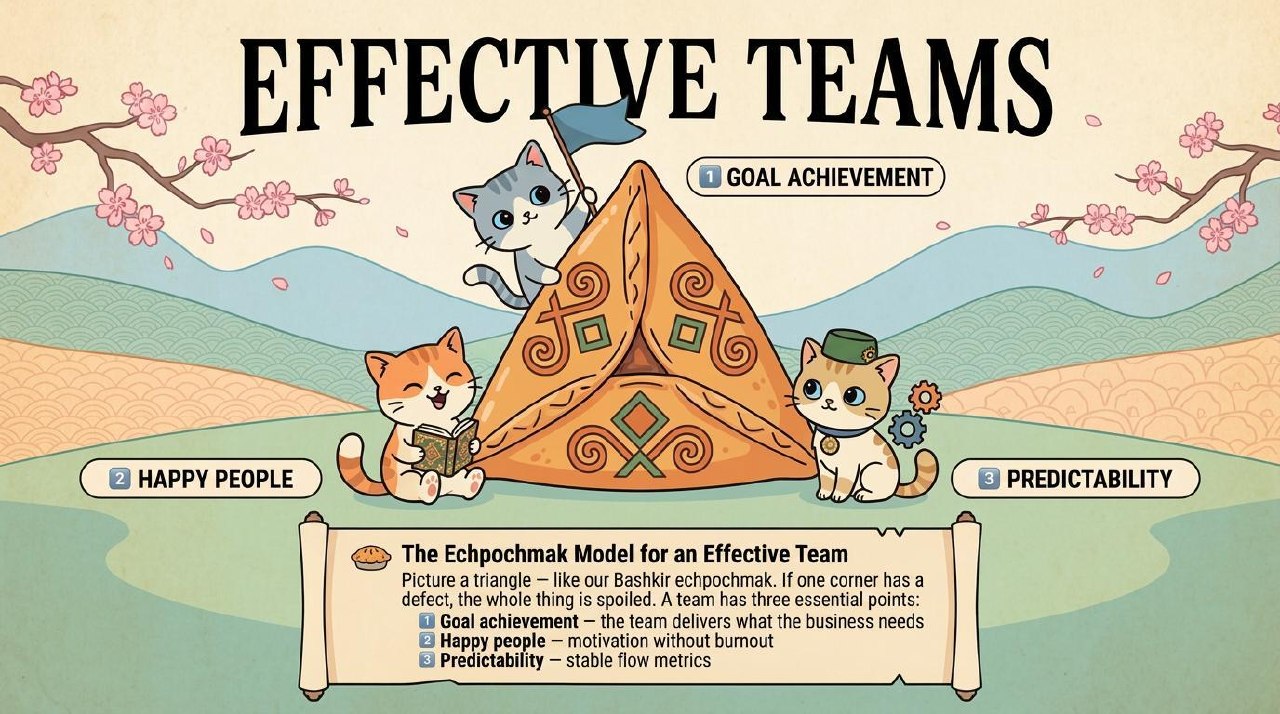
TL;DR: An effective team is one that:
- Achieves its business goals
- Maintains psychological safety and team motivation
- Delivers predictably through stable flow metrics
Three pillars. One triangle.
The Premise
Two fintech teams spent three months building limit management systems in parallel. One for credit cards, one for checking accounts. Each team: 7–8 people, costing ~$100K/month (average US/EU engineering salary $120–150K/year per person, fully loaded).
At the quarterly review, they discovered 70% functional overlap.
Losses: over $600K in duplicated effort. A 1–2 quarter delay to market. Technical debt from building two systems instead of one. And then it turned out neither was actually needed.
Nobody reading this will be surprised. We’ve all seen parallel bicycles.
The industry data is just as grim:
- Only 9% of employees agree that their team’s goals are aligned with company goals (Axios HQ, 2025)
- The remaining 91% optimize their own slice and hope someone needs it
- Meanwhile, 27% of executives believe their teams are well-coordinated (McKinsey)
- Global losses from strategy-execution misalignment: $2 trillion/year (PMI)
The Model
After 10+ years working with teams and their leaders, a pattern emerged. Three factors determine whether a team is truly effective — and they form a triangle. If one corner is broken, everything leaks out.
The Three Pillars
Pillar 1: The team must achieve business goals (Goal Achieving Team)
The team’s work is tied to revenue, conversion, NPS — what matters for the business.
Health metric: did they achieve the goal or not? Not “do they understand the goal” — but “did they deliver the result?”
Understanding is necessary. But we measure results.
Pillar 2: The team must be sustainable (Sustainable Team)
People are motivated, not burning out, and can speak openly about problems. There is psychological safety — you can admit a mistake without fear of punishment.
When people are afraid, problems accumulate. Then the pressure valve blows: attrition, low productivity, burnout, missed deadlines, damaged employer brand.
Pillar 3: The team must be predictable (Predictable Team)
Work moves predictably. The team can answer “when will it be done?” with reasonable accuracy. Flow metrics (Throughput, Lead Time, WIP) are stable and transparent.
If the flow is chaotic, planning and commitments are impossible. (Well, technically possible — just with questionable outcomes.)
Why a Triangle?
Each pillar reinforces the others:
- Clear goals reduce anxiety → people feel safer
- Healthy people can speak honestly about problems → the flow becomes transparent
- Predictable flow builds confidence → easier to focus on goals
And conversely — when one pillar collapses, it drags the others down.
Why Order Matters: Goals → People → Flow
The prioritization sequence is deliberate, backed by independent research.
The most influential finding comes from Richard Hackman’s model at Harvard. In his “5 Conditions for Team Effectiveness,” Compelling Direction (a clear purpose) comes before supporting context, team structure, and coaching.
Without direction, everything else is pointless. A team can be perfectly structured — but if it doesn’t know where it’s going, it’s just moving fast in the wrong direction.
Others reached the same conclusion:
- Amy Edmondson (Harvard) — the “Set the Stage” method begins with the purpose question, not with safety
- McKinsey — calls direction clarity “the first and most forgotten step”; companies with clear direction are 2x more likely to be profitable
- CIPD (2024) — leaders who set mastery goals create environments of psychological safety; goals generate safety, not the other way around
- Google Project Aristotle — psychological safety explains 43% of team effectiveness variance, but without clear goals it becomes comfort without results
Pillar 1: Goals — The Foundation
What We Measure
Effectiveness here = achievement of business results:
- Did revenue grow or not?
- Did conversion improve or not?
- Did NPS increase or not?
Goals can be binary (yes/no), relative (%), or quantitative (from X to Y). Visualized with traffic lights or OKR progress. Reviewed at QBRs or Sprint Reviews.
The Real Problem: Misalignment
Goals often exist. They’re just not reaching the people doing the work.
How it typically breaks down:
- CEO formulates strategy
- Strategy becomes OKRs
- OKRs cascade down the hierarchy
- At each level, context is lost
- An engineer receives a Jira ticket with no connection to any goal
The result: someone completes a task but has no idea how it affects the business. Tasks multiply that the business doesn’t need.
Great Metrics ≠ Business Results
A team can show excellent flow metrics. Stable Throughput. Decreasing Lead Time. Green dashboards.
And still miss every business goal.
Real example: a team spent 6 months building a beautifully architected API with stellar documentation. The client needed a simple Salesforce integration. They didn’t wait — went to a competitor who shipped in 2 weeks.
Pillar 2: People — Sustainability
Psychological safety is the belief that you can speak up without fear of punishment. Combined with sustainable motivation (financial, interesting work, skill growth), this determines whether a team can perform over time.
The Edmondson Paradox
High-performing teams report more errors than low-performing ones. Because they’re not afraid to talk about them.
- Low-performing teams hide mistakes → mistakes accumulate → explode in production
- High-performing teams surface mistakes immediately → fix faster → learn
Connection to Goals
When goals are clear, fear drops. People understand the criteria by which they’re evaluated. Less uncertainty → less anxiety.
When goals are fuzzy, everything becomes subjective. People play it safe, hide problems, avoid risk.
Clear goals → less fear → more honesty → faster feedback.
Pillar 3: Flow — Predictability
Here we measure predictability — the team’s ability to answer “when will it be done?” with reasonable accuracy.
Key Metrics
| Metric | What It Measures |
|---|---|
| Throughput | How many items completed per period |
| Lead Time | Time from creation to completion |
| WIP | How many items are in progress simultaneously |
The relationship is described by Little’s Law: Lead Time = WIP / Throughput
Want to go faster? Reduce WIP. It’s counterintuitive, but mathematically proven.
The Key Insight: No Correlation Between Goals and the Other Pillars!
Over 7 years of data from ~75 teams:
- Correlation between good flow metrics and achieving business goals: below 0.60
- Correlation between high motivation and achieving business goals: below 0.60
This means: you can have a motivated, cohesive team that delivers fast and predictably — but builds the wrong thing.
Flow metrics and motivation surveys are necessary but not sufficient. Without connection to goals, it’s a fast flight in the wrong direction with a beautiful dashboard.
Three Traps When Metrics Come First
Trap 1: Optimizing speed instead of direction The team chases Throughput. Hires more people, closes more tickets. But if tickets aren’t connected to goals — it’s useless activity.
Trap 2: Metrics as the goal (Goodhart’s Law) When a metric becomes a target, it ceases to be a good metric. The team inflates Throughput by slicing tasks thinner, closing them “formally,” ignoring quality. Metric goes up, value goes down.
Trap 3: Local optimization The team optimizes its own area, but handoffs to other teams remain bottlenecks. Example: an ATM channel team shows 20-day cycle time. 14 of those days — waiting for a vendor response. The team isn’t slow. 70% of their cycle is idle time at the boundary.
Check Your Team
Goals
- Team achieves its business goals
- Clear connection between team’s work and business outcomes
- Priorities are clear — team knows what matters most
- Less than 30% of sprint tasks are unrelated to business goals
Ask the team: “How does this task affect the business goal?”
- “Directly impacts conversion” — great
- “It’s tech debt blocking feature X” — acceptable
- “I don’t know” — problem
- “It doesn’t, but it’s important” — big problem
People
- Retrospectives openly discuss mistakes and failures
- People ask questions and propose alternatives
- New team members aren’t afraid to admit what they don’t understand
- Conflicts aren’t swept under the rug
Flow
- Team can forecast with ±30-40% accuracy
- WIP is limited and controlled
- Metrics are stable from sprint to sprint
- Blockers are visible and escalated quickly
What to Do Next
- Diagnose — walk through the checklist, find the weakest pillar
- Fix goals first — if they’re unclear, nothing else matters
- Create traceability — from task to sprint goal, from sprint goal to quarterly objective
- Sync leaders — parallel bicycles are caught at this level
Related
- Zero Bug Policy: From 77 Bugs to 18 in One Month — a Flow practice (Pillar 3) that only works with Pillars 1 and 2 in place
- Boosting Efficiency with WIP Aging — practical tools for Pillar 3
- Monte Carlo Simulation for Throughput Forecasting — predictability in action
- Try it with your data: predictable.team — free tool for analyzing your team’s flow metrics
- Russian version: Хабр: Модель эффективной команды «Эчпочмак»